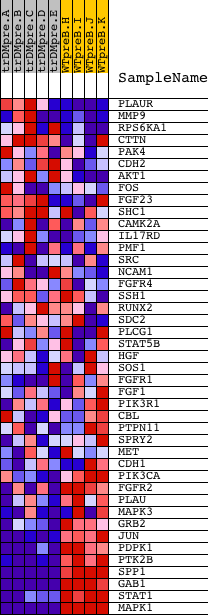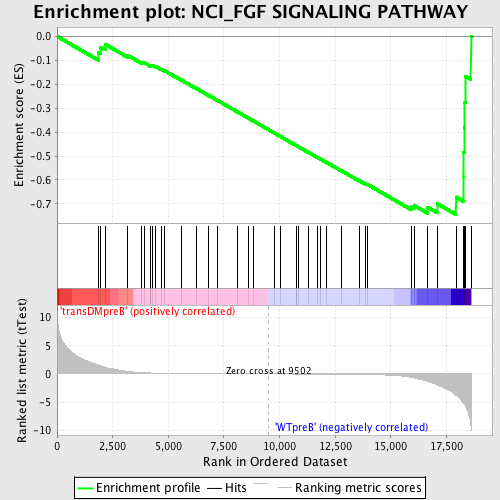
Profile of the Running ES Score & Positions of GeneSet Members on the Rank Ordered List
| Dataset | Set_04_transDMpreB_versus_WTpreB.phenotype_transDMpreB_versus_WTpreB.cls #transDMpreB_versus_WTpreB |
| Phenotype | phenotype_transDMpreB_versus_WTpreB.cls#transDMpreB_versus_WTpreB |
| Upregulated in class | WTpreB |
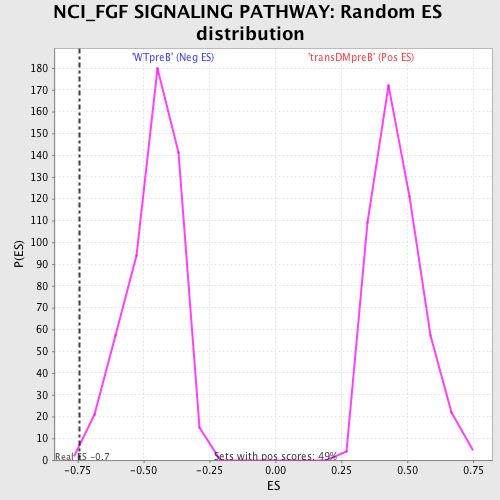
| GeneSet | NCI_FGF SIGNALING PATHWAY |
| Enrichment Score (ES) | -0.74407697 |
| Normalized Enrichment Score (NES) | -1.6066245 |
| Nominal p-value | 0.003921569 |
| FDR q-value | 0.0440305 |
| FWER p-Value | 0.537 |
| PROBE | DESCRIPTION (from dataset) | GENE SYMBOL | GENE_TITLE | RANK IN GENE LIST | RANK METRIC SCORE | RUNNING ES | CORE ENRICHMENT | |
|---|---|---|---|---|---|---|---|---|
| 1 | PLAUR | 18351 | 1849 | 1.600 | -0.0684 | No | ||
| 2 | MMP9 | 14732 | 1952 | 1.461 | -0.0454 | No | ||
| 3 | RPS6KA1 | 15725 | 2164 | 1.195 | -0.0334 | No | ||
| 4 | CTTN | 8817 4575 1035 8818 | 3175 | 0.421 | -0.0796 | No | ||
| 5 | PAK4 | 17909 | 3777 | 0.232 | -0.1075 | No | ||
| 6 | CDH2 | 1963 8727 8726 4508 | 3908 | 0.209 | -0.1104 | No | ||
| 7 | AKT1 | 8568 | 4184 | 0.164 | -0.1220 | No | ||
| 8 | FOS | 21202 | 4219 | 0.162 | -0.1207 | No | ||
| 9 | FGF23 | 17275 | 4292 | 0.153 | -0.1216 | No | ||
| 10 | SHC1 | 9813 9812 5430 | 4421 | 0.139 | -0.1257 | No | ||
| 11 | CAMK2A | 2024 23541 1980 | 4700 | 0.115 | -0.1384 | No | ||
| 12 | IL17RD | 22069 | 4844 | 0.107 | -0.1441 | No | ||
| 13 | PMF1 | 12452 | 5574 | 0.069 | -0.1820 | No | ||
| 14 | SRC | 5507 | 6271 | 0.049 | -0.2185 | No | ||
| 15 | NCAM1 | 5149 | 6809 | 0.038 | -0.2467 | No | ||
| 16 | FGFR4 | 3226 | 7187 | 0.031 | -0.2663 | No | ||
| 17 | SSH1 | 10540 | 8096 | 0.018 | -0.3149 | No | ||
| 18 | RUNX2 | 4480 8700 | 8624 | 0.011 | -0.3430 | No | ||
| 19 | SDC2 | 9134 | 8846 | 0.008 | -0.3548 | No | ||
| 20 | PLCG1 | 14753 | 9775 | -0.004 | -0.4047 | No | ||
| 21 | STAT5B | 20222 | 10037 | -0.007 | -0.4186 | No | ||
| 22 | HGF | 16916 | 10749 | -0.016 | -0.4565 | No | ||
| 23 | SOS1 | 5476 | 10751 | -0.016 | -0.4563 | No | ||
| 24 | FGFR1 | 3789 8968 | 10852 | -0.018 | -0.4613 | No | ||
| 25 | FGF1 | 1994 23447 | 11317 | -0.024 | -0.4858 | No | ||
| 26 | PIK3R1 | 3170 | 11694 | -0.031 | -0.5055 | No | ||
| 27 | CBL | 19154 | 11843 | -0.033 | -0.5128 | No | ||
| 28 | PTPN11 | 5326 16391 9660 | 12087 | -0.038 | -0.5251 | No | ||
| 29 | SPRY2 | 21725 | 12763 | -0.054 | -0.5604 | No | ||
| 30 | MET | 17520 | 13610 | -0.086 | -0.6043 | No | ||
| 31 | CDH1 | 18479 | 13868 | -0.102 | -0.6161 | No | ||
| 32 | PIK3CA | 9562 | 13936 | -0.107 | -0.6176 | No | ||
| 33 | FGFR2 | 1917 4722 1119 | 15914 | -0.587 | -0.7126 | No | ||
| 34 | PLAU | 22084 | 16045 | -0.693 | -0.7061 | No | ||
| 35 | MAPK3 | 6458 11170 | 16645 | -1.295 | -0.7131 | Yes | ||
| 36 | GRB2 | 20149 | 17099 | -1.953 | -0.6994 | Yes | ||
| 37 | JUN | 15832 | 17929 | -3.751 | -0.6710 | Yes | ||
| 38 | PDPK1 | 23097 | 18270 | -5.228 | -0.5874 | Yes | ||
| 39 | PTK2B | 21776 | 18273 | -5.239 | -0.4854 | Yes | ||
| 40 | SPP1 | 5501 | 18309 | -5.401 | -0.3820 | Yes | ||
| 41 | GAB1 | 18828 | 18330 | -5.503 | -0.2758 | Yes | ||
| 42 | STAT1 | 3936 5524 | 18359 | -5.675 | -0.1667 | Yes | ||
| 43 | MAPK1 | 1642 11167 | 18603 | -9.259 | 0.0007 | Yes |